Customizing Views
The article focuses on customizing views within the SiteAudit Viewer. It provides a detailed guide on how to personalize, save, and access different views in the system. Key customization options include setting time spans, selecting departments, modifying columns (adding, removing, reordering), grouping, filtering, and setting aggregates. Additionally, it explains how to use these custom views effectively, including saving and opening them, as well as optimizing display settings for different formats like PDF, CSV, RTF, HTML, XLS, and XML. This guide is essential for users looking to tailor their SiteAudit experience to their specific needs and preferences.
Contents
Feature Overview
SiteAudit offers the flexibility to customize and export any view in multiple formats, such as PDF, CSV, RTF, HTML, XLS, and XML. You can save customized views for future use, reopen them within SiteAudit, publish them to the SiteAudit Reporting Web site for online review, and even schedule them for periodic archival or delivery to specified email recipients. This article provides step-by-step instructions on how to tailor, save, and access customized views according to your specific requirements.
Customizing SiteAudit Views
Any SiteAudit view can be customized to display desired information.
A view can be customized by:
- Setting the Time Span
- Selecting a Department
- Adding/removing columns
- Reordering columns
- Grouping by columns
- Filtering
- Setting aggregates
- Modifying Display Configuration settings
The following sections provide details describing the ways in which a
view can be customized.
Time Span
The Time Span in SiteAudit indicates the duration for which monitored data has been collected for devices. As SiteAudit continuously monitors, more data accumulates and becomes available in various views. The display speed of data in a view is influenced by the volume of data to be presented. Therefore, there are instances when it's convenient to configure the Time Span to show data for a specific, narrower time frame.

Figure 1: The SiteAudit Time Span bar.
The Time Span dropdown control contains predefined time spans that can be selected to display data for a desired period. For example, you might want to create a custom view that only displays data for the current month. In such a case, you can choose "This Month" from the dropdown list. When you open the view, it will consistently show data for the period chosen in the Time Span, which in this instance is the current month.
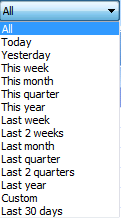
Figure 2: Preconfigured periods from the Time span dropdown list.
If none of the predefined Time Span periods are suitable for your needs, you have the option to specify a custom Time Span. Simply select "Custom" from the dropdown list and input your desired time period. After entering the time period, click the "Set" button to save your selection.
Department Selection
It is often necessary to display data for a particular department instead
of displaying data for the entire company. By selecting a department, only data for printers that reside in
that department and its sub-departments are displayed. Selecting Company displays data for all departments.
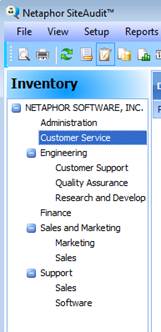
Figure 3: Company hierarchy with department selected.
Displaying Columns
Some views may display columns that a user is not interested in
viewing. These columns can be hidden by
right-clicking on the column header and choosing Remove This Column from
the popup menu. Removed columns are placed in the Column Chooser and can be added to the view at any time. In addition, all views contain some hidden
columns, which can be viewed by right-clicking a column header and selecting Column
Chooser from the popup menu. The Column Chooser in Figure 4 shows the
hidden columns for the Inventory view. To display one of these columns,
right-click on the column name and select Show This Column from the
popup menu.
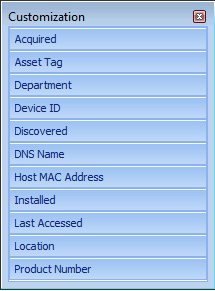
Figure 4: The Column Chooser contains all of the
hidden columns that can be displayed in the view.
Column Reordering
It may be desirable to reorder columns. This can easily be done by dragging a column header to the desired
location and releasing it.
Grouping
A view can be grouped by one or more columns to group the displayed
information. For instance, it may be necessary to display data grouped by the printer manufacturer and/or model as
shown in Figure 5 below.
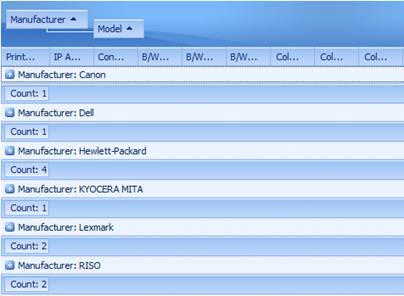
Figure 5: View grouped by manufacturer and model.
To group by a particular column, right-click on the column header and
choose Group By This Column from the popup menu. To ungroup a column, right-click on the grouped column name and select Ungroup
from the popup menu.
Filtering
A view can be
filtered by any column to display the desired data. In SiteAudit versions prior to 4.0, scheduled
reports were filtered using special filter files that were complex for some
users to create. SiteAudit 4.0 makes it
very easy to filter views and thus create reports that are filtered as well.
There are two
ways to filter a view: via the column filter or by clicking the Edit Filter button and entering filters
in the Filter dialog.
Using the Column Filter
When the mouse
is hovered over a column header, a small filter icon appears in the top right
corner. See example in Figure 7 below.

Figure 7: Filter icon displayed on
Manufacturer column when mouse is hovered over the column header.
Click the
filter icon to display a list of all the unique values in the column. Choose one of the values to filter, for
example, the Lexmark manufacturer. The
active filter is displayed at the bottom of the view as shown in Figure 9.
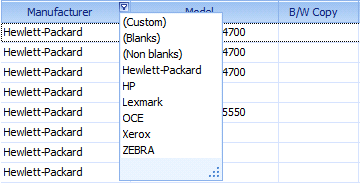
Figure 8: Manufacturer filter
displays all manufacturers in the database.
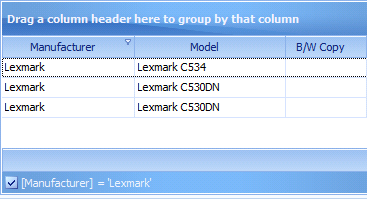
Figure 9: Shows the results when
filtering the manufacturer to show Lexmark data.
Using the Filter Editor
Using the Filter
Editor allows for more sophisticated filters than can be applied
using the column filters. For instance,
it is possible to display data that is within a specified range or that contains
particular characters.
For example, one can
create a filter that shows only active, networked, HP or Lexmark printers that
have printed between 5,000 and 7,000 color pages. The filter for this example is shown below in Figure 10.
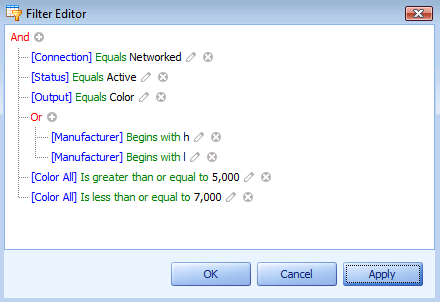
Figure 10: Sample filter.
Take notice of the Manufacturer filter in Figure
10. Only the first letter of the
manufacturer name is used, thus any manufacturer that begins with the letter
“h” or “l” will be included in the view, provided it meets the rest of the
filter criteria. Strings are
case-insensitive in a filter, thus using “H” or “L” produces the same results.
Aggregates
Aggregates are available for
each column in a view and can be selected by right-clicking the light blue
footer above the filter information to expose the aggregate chooser as shown in
Figure 11.
The available aggregates
include NONE, SUM, COUNT, AVG, MAX and MIN and are available for all columns,
although they may not be appropriate to use for all columns. For instance, it would not make sense to use
the SUM, AVG, MAX or MIN aggregate on the Model column, but it would make
sense to use COUNT. Figure 12 shows a
view with various aggregates configured.
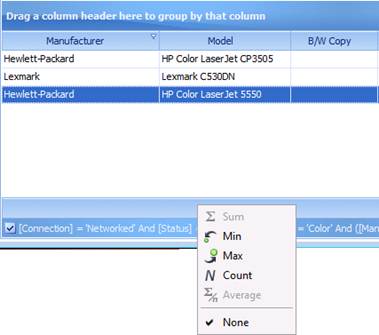
Figure 11: Aggregate chooser.
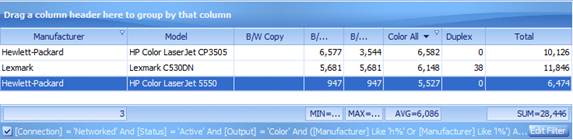
Figure 12: A view with various aggregates. Note: Manufacture
column uses COUNT aggregate.
Saving a Custom View
In SiteAudit 4.0 and later, it is possible to save customized views, which can then be
published to the SiteAudit Reporting Web site or scheduled to be archived or
delivered via email. Once a view has
been configured as desired, select the File > Save or File >
Save As menu item and save the view.
If text is
getting truncated in columns, view files can be further configured to provide
more horizontal space. Before saving a
view, resize columns as desired and change the page size and orientation by
selecting the Reports > Layout
menu item and configuring these options there. The Landscape orientation will provide more horizontal page width
compared to Portrait and there are many page size options that are larger than
the standard Letter-sized page.
Opening a Custom View
Saved views can
be opened and displayed in the SiteAudit Viewer by selecting Open from
the File menu and choosing the view to open or by selecting the view
name from the File > Recent Views
menu. When a view is in the SiteAudit Viewer, the view file name and path
are displayed at the top of the SiteAudit Viewer as shown in the screenshot
below. The view from name is displayed
above the Company name with a diamond symbol to indicate that the displayed
view is a custom view.
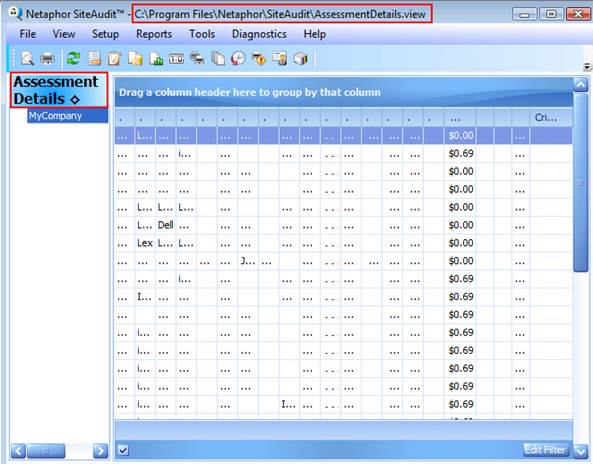
Figure 14: Custom View Opened inside the SiteAudit Viewer.