SiteAudit Visualizer
Guide
In This Article:
June 2014
- Visualizer Overview
- License &
Installation
- Visualizer
Operations
This article
provides information for installing and operating SiteAudit VisualizerTM. The
audience for this article is audit advisors and technical consultants.
Table of Contents
SiteAudit Visualizer
Overview....................................................................................
2
Basic Workflow
..........................................................................................................
3
Visualizer
Prerequisites
.............................................................................................
3
Visualizer License
......................................................................................................
4
Recommended Platform
............................................................................................
4
Visualizer
Installation
................................................................................................
4
SiteAudit Viewer
Operations
.....................................................................................
6
Preparing to Use
Visualizer
........................................................................................
8
Visualizer
Operations
................................................................................................
8
Steps to Create a
Visualizer Floor Map
....................................................................... 9
Visualizer Add-ins
.....................................................................................................
12
Selecting the Data
Source
..........................................................................................
13
Selecting &
Using the Visualizer Inventory Explorer
................................................... 13
Printer Icons
..............................................................................................................
15
Data Labels
................................................................................................................
15
Visualizer Analysis
.....................................................................................................
16
Relocation Analysis
....................................................................................................
17
Multi-Floor Map
Analysis
...........................................................................................
17
Visualizer
Frequently Asked Questions
...................................................................... 18
SiteAudit Visualizer
Overview
The SiteAudit
Visualizer is a Visio plug-in that allows users to map printers to floor plans
and take advantage of the superior graphics and drawing features of Microsoft
Visio. The Visualizer provides floor mapping placement analysis. The analysis
helps determine if a device is properly placed given its volume and
utilization. The primary use of the software is for audits and ongoing
consulting.
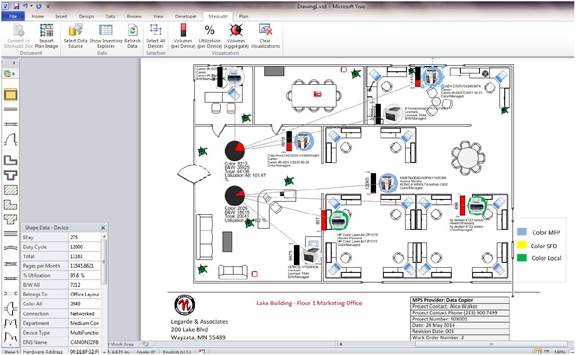
Visualizer Floor
Map
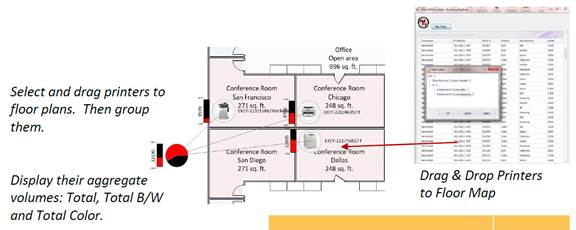
Visualizer users can
drag and drop printers onto a floor map using device icons. Once a map has been
completed it can printed and incorporated into an audit or consulting
proposal.
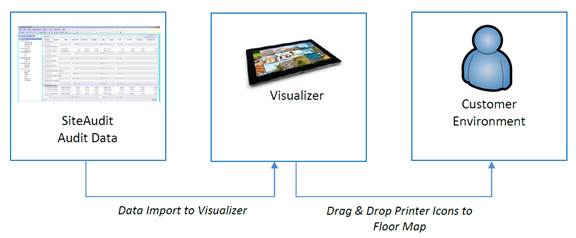
Basic Workflow
The process of using
Visualizer starts with collected SiteAudit data. Typically data is selected
from a specific time
span such as for 30 or 60 days. An audit advisor or consultant will select a
date range then
export the data via the SiteAudit viewer. Visualizer runs as a Visio plug-in on
a
separate machine
e.g. tablet or same machine where the data is collected. The data will be
imported into
Visualizer. A floor map will be selected and the advisor or consultant will
walk
the customer’s floor
dragging and dropping printer icon where the physical printers are located.
Once this is
complete the advisor can perform utilization or other analysis using Visualizer
to
optimize the printer
placement.
Data can be used
from all SiteAudit data collection software including the following software:
- SiteAudit On-Site
- SiteAudit Hosted
- SiteAudit
Compact
Visualizer
Prerequisites
Before Visualizer
can be installed and operated there are several prerequisites which must be
installed. These are
listed below.
1. Microsoft Visio
2010/2013/2016 Professional or Premium Edition
- Visio 32-bit for
32-bit systems
- Visio 64-bit for
64-bit systems
2. Microsoft
.NET4.5.1*
3. SiteAudit V6.x
Viewer*
4. Visual Studio
2010 Run Time Distributable*
5. License with
Visualizer Capability
* Available from the
Netaphor software download site
Visualizer License
Visualizer is
licensed as an additional capability of SiteAudit. Existing V6.x licenses can
be upgraded to include Visualizer or Visualizer can be included in a new
license. There is an additional cost for the Visualizer capability. Cost
inquiries can be made to sales@netaphor.com
To obtain a
Visualizer license contact licensing@netaphor.com Include in your email the
current license key and the version of SiteAudit you are running.
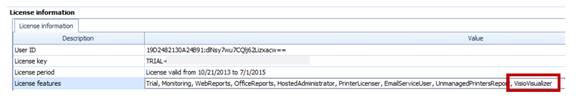
Note: Once the Visualizer license capability has been added to your license key
it can be confirmed by checking the Configuration Details located under the
Diagnostics menu.
Recommended Platform
Visualizer is
designed to run on a PC/Laptop or Tablet running Windows 7 or 8. Consideration
to adequate screen size is important to facilitate mobile usability. The
recommended system configuration is below.
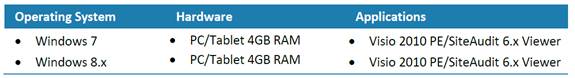
Suitable platforms
include the Microsoft Surface Pro products, Lenova ThinkPad Helix and other
popular tablets from a variety of manufacturers.
Visualizer Installation
Before installing
the Visualizer please install the prerequisites first.
- Microsoft Visio 2010/2013 Professional or Premium Edition
- Microsoft .NET4.5.1*
- SiteAudit V6.x
Viewer*
- Visual Studio 2010
Run Time Distributable*
- License with
Visualizer Capability
* Available from the
Netaphor software download site (www.netaphor.com)
Follow the ‘Try It Out’ home page link.
Install SiteAudit
V6.x. It can be installed over previous versions of SiteAudit. If you have
already installed V6.x without the Visualizer capability you should install the
prerequisites first and then reinstall V6.x.
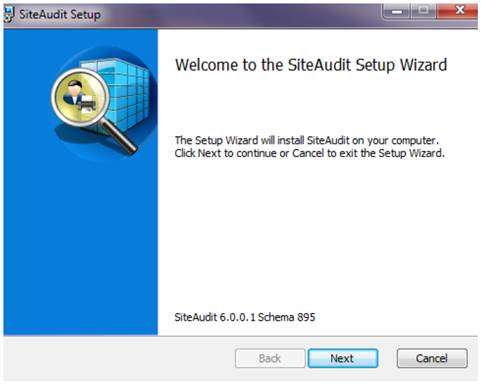
Select Next
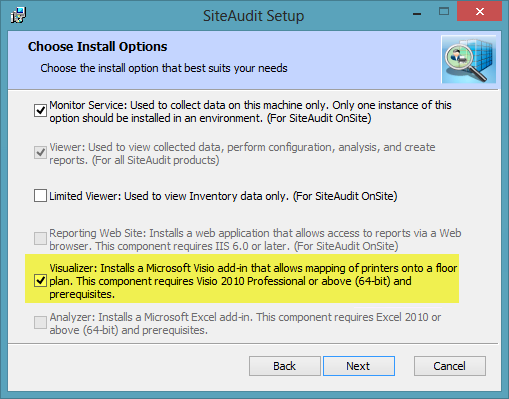
Check the Visualizer box and then Next
Note: If you do not
have the prerequisites installed the Visualizer installation option will be
grayed out.
Complete the
installation process. Once the SiteAudit installation is completed launch the
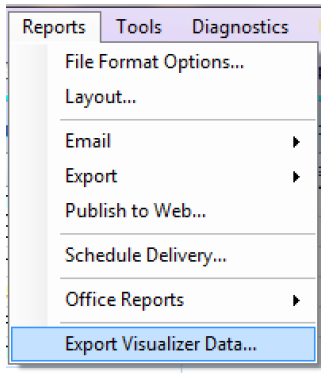
SiteAudit viewer and go to the Reports menu. The Visualizer license enables a
new menu item called Export Visualizer Data.
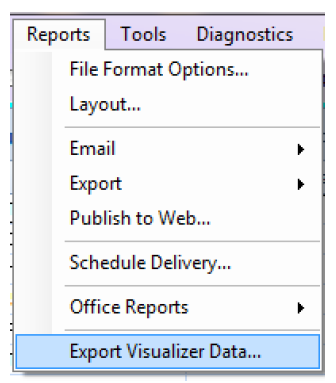
You can now export
data so it can be imported into Visualizer.
SiteAudit Viewer
Operations
A SiteAudit viewer
licensed for the Visualizer is required. The SiteAudit viewer allows the audit
advisor or consultant to specify the data and the date range desired for
export. It allows the filtering of inventory, for example by manufacturer,
model, department etc…, for export. The Visualizer also has the capability for
filtering so it may be desirable to export all inventory.
To export data do
the following;
1- Select the
Assessment Details or Volume Analysis view.
2- Use Edit Filer to
select the manufacturers, models you want to map or use all inventory
3- Go to Time Span
and select the date range you want. A 30-day date range is recommended
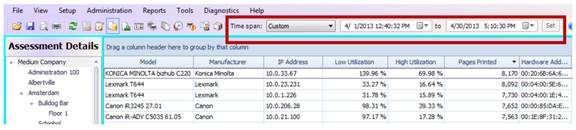
SiteAudit Viewer
4- Select the Set
button
5- Go to the Reports
menu and select the Export Visualizer Data
6- The option to include unmanaged and retired printers is presented. Unmanaged
printers will provide only Inventory data unless you are licensed for unmanaged
printers. If you are licensed for unmanaged printers volume and utilization
date is present. Retired printers will provide data up to the date they were
retired.
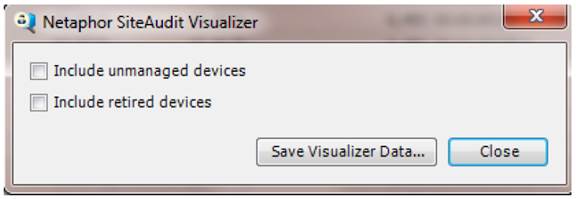
If you are running a 30 - 60 day audit you may assume all devices are managed
and only consider if you want to include retired devices in the export.
Select Save
Visualizer Data… You will be prompted to add a file name and then select
Save.
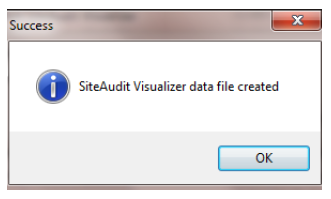
Once the Visualizer
data file has been created you will see this message and then click OK. The
data export has been saved. The format saved is .csv. An example is
FloorMapData1.csv.
The file should be accessible by Visualizer as it will be used as the Data
Source.
Preparing to Use
Visualizer
SiteAudit Visualizer
runs as a Microsoft Visio plug-in. A SiteAudit viewer
licensed for Visualizer must run on the same PC/Laptop or Tablet as the
Visualizer plug-in.
To prepare for
Visualizer operations the audit advisor or consultant should have two items:
1. Customer floor
map(s) as a saved image file or the knowledge to use Visio to create floor maps
2. The Data Source
file(s) exported by SiteAudit Visualizer Export Data found under the Reports
menu. The file(s) is in .csv format.
Map Image Formats
Floor map format
supported include .jpg, .gif. png, .bmp, .tiff or .wmf.
Visualizer
Operations
To begin Visualizer
operations launch Visio.
SiteAudit Visualizer
If you have never
launched Visio with the Visualizer plug-in before it will prompt you to.
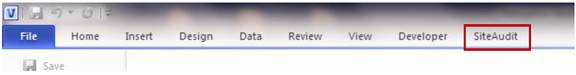
Once Visio with the
Visualizer plug-in is launched the SiteAudit menu item is visible.
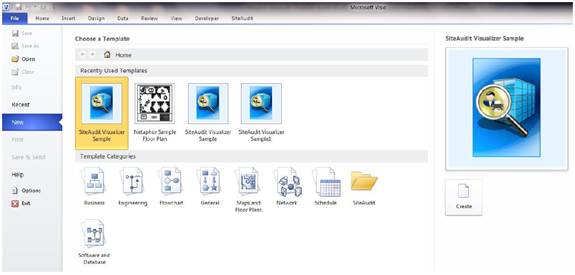
Steps to Create a
Visualizer Floor Map
A Visualizer floor
map can be created from any image file or a Visio template. The audit advisor
or consultant starts the process by doing one of the following:
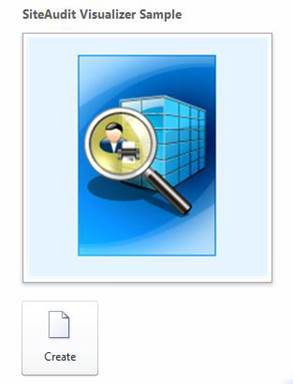
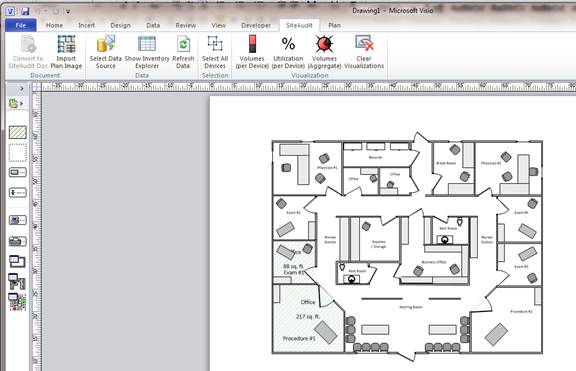
SiteAudit Visualizer
If a customer floor
plan is not available the audit advisor or consultant may also select the
Visualizer sample floor plan.
 Sample Visualizer
Floor Plan
Sample Visualizer
Floor Plan
Select the Create
button. The sample floor plan is launched.
Using the Visualizer Visio sample floor plan provides a quick floor plan which
can be modified to specific requirements. It can also be used for demonstration
purposes.
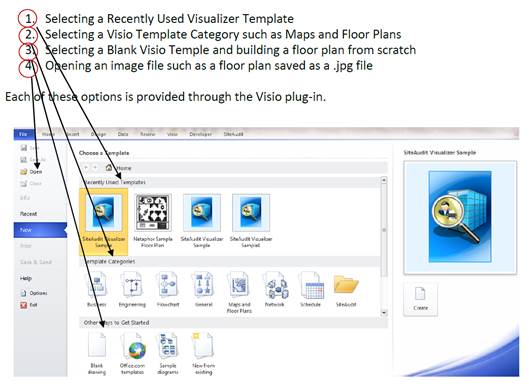
If the audit advisor or consultant decides the best process for creating a
floor map is to select a Visio Temple, or a blank template or an image file
(items #2, #3 and #4 above) the following procedure is followed.
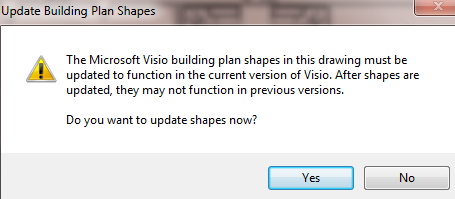
1- Open the desired
file, you may be asked to update the shapes now, select Yes and continue.
The floor plan is
now open. Next select the SiteAudit plug-in menu
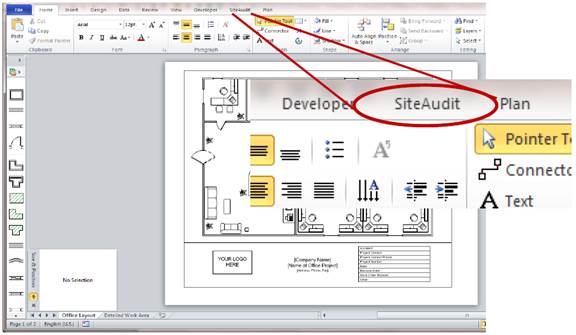
Opened Visio Floor Plan
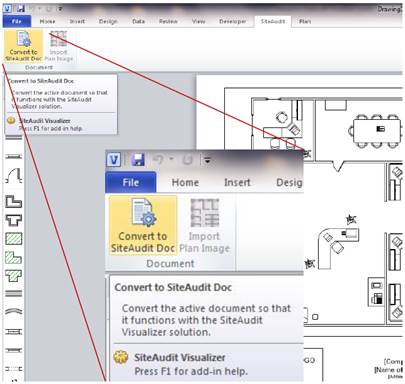
2- Select Convert to
SiteAudit Doc and this will convert the document so it can be used with the
Visualizer.
Once this is complete a set of customer Visualizer add-ins is displayed which
will allow the audit
advisor or
consultant to select the Data Source, Open the Inventory Explorer and work with
the analysis add-ins.
Visualizer Add-ins
The add-ins provides
the mapping and analysis capability of Visualizer.
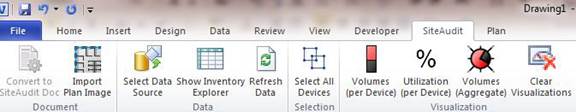
Visualizer Add-ins
- Select Data Source –
first step after converting the floor plan format to a SiteAudit Visualizer document.
Use this button to find the SiteAudit Data Export and import the data into the
Visualizer.
- Show Inventory
Explorer – typically the second step and opens an inventory view of the printers to be
mapped to the floor plan(s).
a) The Inventory
Explorer can filter, group and sort inventory by Manufacturer, Model, Department, Device
Type and other data fields. It utilizes the customization Chooser that provides
flexible filtering in the SiteAudit viewer.
b) Printer(s) are
dragged and dropped from the Inventory Explorer as icons on to the floor map(s).
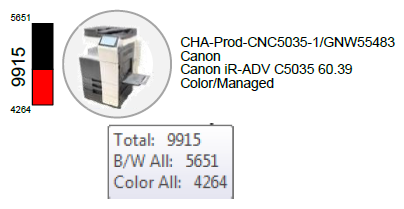
- Volume (per Device)
is an analysis metric that indicates the amount of monochrome and/or color
printing for the data period typically one month. To see the volume break in
text format mouse over the printer icon.
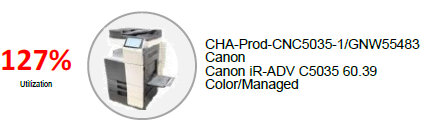
- Utilization (per
Device) is an analysis metric that indicates the low utilization percentage for the data period,
typically one month. A percentage that is Red color indicates above low utilization. A green
color indicates below low utilization
- Volume (Aggregate)
is an analysis metric indicating the aggregate or sum of the selected printers.
Two or more printers can be selected.
Selecting the Data Source
The Visualizer
export data must be selected before use Inventory Explorer can be used. To
select a data source select the Data Source add-in button.

Find the data export
and select Open
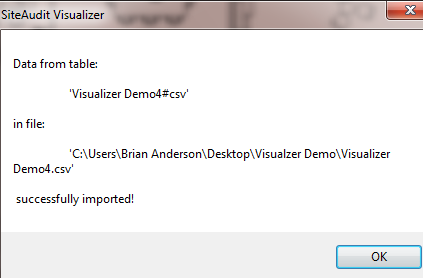
A screen will pop up
indicating the data import was successful.
The audit advisor or consultant can now open the Inventory Explorer and begin
the mapping process.
Selecting &
Using the Visualizer Inventory Explorer
The Inventory
Explorer shows the printers which have been imported into Visualizer. The audit
advisor or consultant can filer, group and sore the list. Once the printer(s)
have been identified for placement on the map then they can dragged from the
Inventory Explorer onto the floor plan.
To open the
Inventory Explorer select the Show Inventory Explorer add-in button.

The Inventory
Explorer will open, can be resized and positioned to allow easy dragging of
printer icons to the floor map.
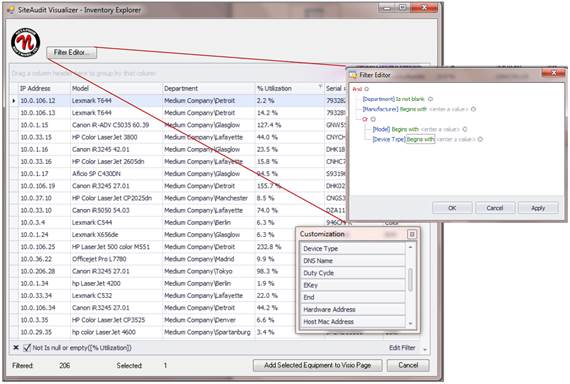
Visualizer Inventory Explorer
The Inventory
Explorer allows the filtering of printers. Use the Filter Editor to identify
specific printers for mapping.
To use the Inventory
Explorer do the following:
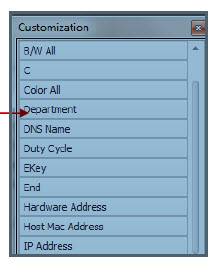
1- Select the
desired Column Fields into the Inventory Explorer window. Right on any Column
head and select Column Chooser to bring up the Customization list
2- Select one or more printers—hold the Control Alt key to select more than
more printer
3- At the bottom of the Inventory Explorer select the button marked Add
Selected Equipment to Visio Page, this will add the printers to the floor plan.
The number selected devices is indicated as well as the remaining printers in
the Inventory Explorer
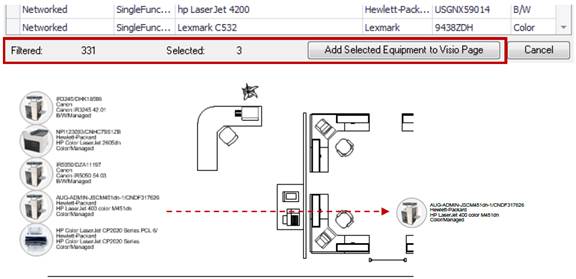
The printer icons are placed on the map and can be repositioned to their proper
place within
the map by dragging
them to the correct physical location.
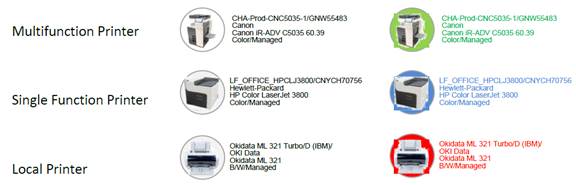
Printer Icons
Visualizer provides
three printer icons. These are represented by a Multifunction printer icon, a
Single Function
printer icon and a Local printer icon. A data label accompanies each icon. The
audit advisor or
consultant can use Visio to color code the icon based on requirement. For
example
Multifunction printers can be coded Green for color and white for monochrome
printer.
Data Labels
A data label is
positioned next to all printer icons. It identifies key attributes of the
printer. The
standard data label
includes:
- Printer Name
- Manufacturer
- Model
- Output type (color
or monochrome)
- Managed or
Unmanaged
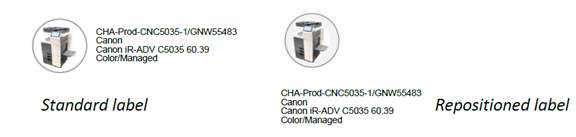
Device labels can be
repositioned to better fit their location on the floor map. Simply click on the
Yellow diamond to reposition the label.
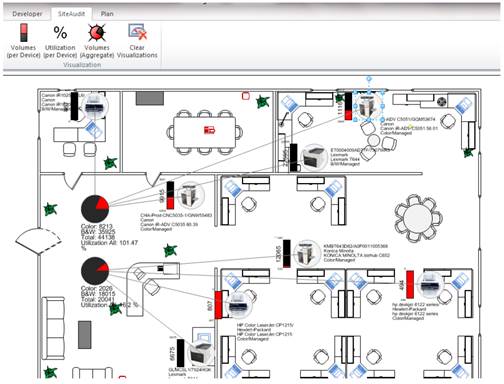
Visualizer Analysis
Select any single or
group of printer icons to see volumes and utilization metrics.
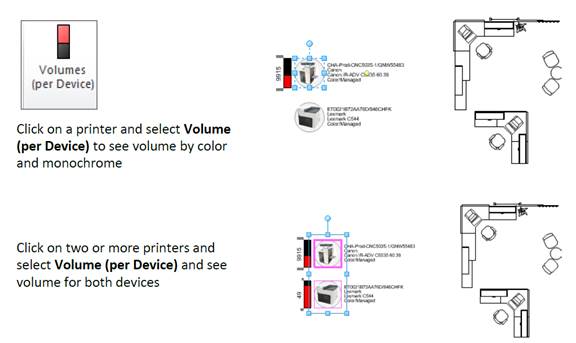
Select Volume (Aggregate) to the sum of both printers and their average utilization

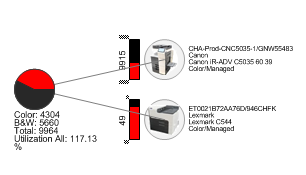
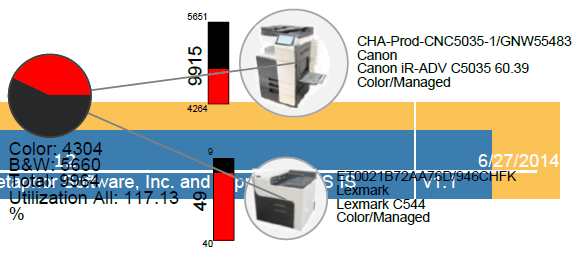
Relocation Analysis
Compare one group of
printers versus another by select the top group of printers and the Volume
Aggregate and performing the same selection process on the bottom group of
printers.
Printer icons can be
relocated and their volumes or utilization aggregated to show the impact of
relocating printers.
Multi-Floor Map
Analysis
The audit advisor or
consultant can work on multiple maps using the Inventory Explorer. Just select
pages listed e.g. Floor Map 1, Floor Map 2 and Floor Map 3.

Visualizer
Frequently Asked Questions
Detailed below are
frequently asked questions and their answers regarding Visualizer. You can read
more about specific Visualizer topics by visiting the Netaphor support portal, https://support.netaphor.com/
- Can printer icon
colors change to represent different printer types e.g. color printers?
Yes they can. You
can use the Visio font and fill color pallet to colorize and code the printer
icons
- Can data labels be
changed?
Yes they can. There
are certain recommended guidelines such as the number of label runs should not
exceed three. The list of possible labels is limited to the data fields in the
Customization list. The customization list is displayed by right clicking a column
head in the Inventory Explorer and select Column Chooser.
You can read more
about specific Visualizer topics by visiting the Netaphor support portal, https://support.netaphor.com/
- Can the data export
file be modified to include printers that are not in the data collection?
Yes the data export
(Data Source) .csv file can be supplemented. The most practical explain is to
add analogue devices which cannot be discovered.
You can read more
about specific Visualizer topics by visiting the Netaphor support portal, https://support.netaphor.com/
Netaphor Software,
Inc
15510 Rockfield
Blvd, C-100,
Irvine, Ca 92618 USA
Phone: (1)
949-470-7955 949-470-7955
Fax: (1)
949-470-4966949-470-4966
www.netaphor.com
Sales email address:
sales@netaphor.com
Support email
address: support@netaphor.com
The attached guide explains the feature and usage of the Netaphor
SiteAudit™ Visualizer introduced in version 6.0