Filtering data enables you to create special reports and fleet metrics for cost and service management. For example, you can determine the 25 most problematic printers, the monthly color print volume for HP color LaserJets, or estimate the number of help desk calls by month.
Viewer Basics
Filtering is just one way to customize the standard views of data, and you can use it in conjunction with other ways. Before you understand filtering, you should understand the standard views and how you can modify their display.
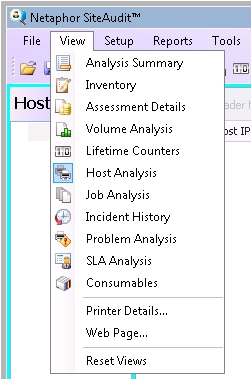
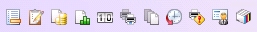
The standard views are available on the View menu and the toolbar.
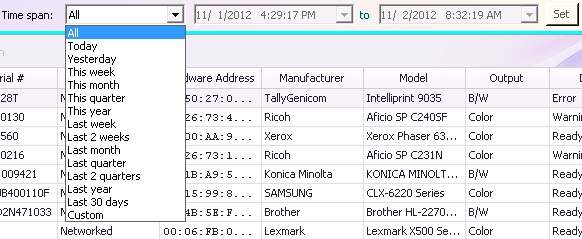
Also on the toolbar, you can adjust the time span for which SiteAudit displays data.
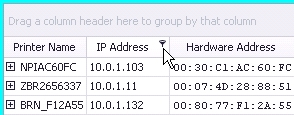
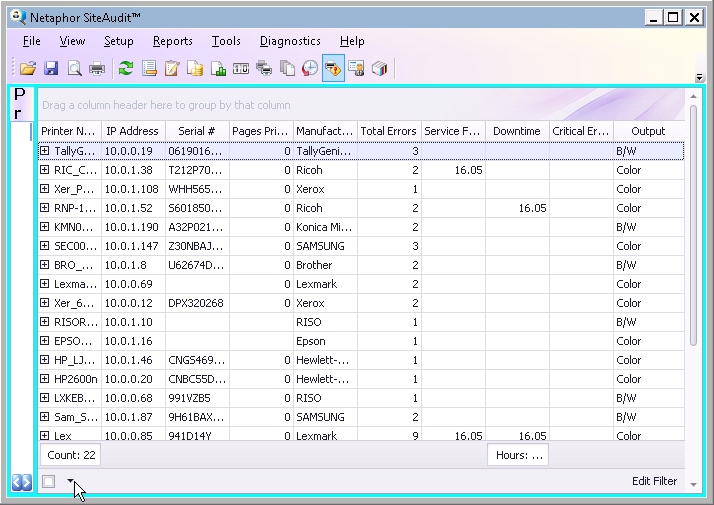
In the information grid, you can add and remove columns, change the order of columns, change the width of columns, and group and sort data by column.
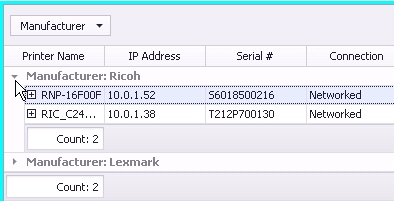
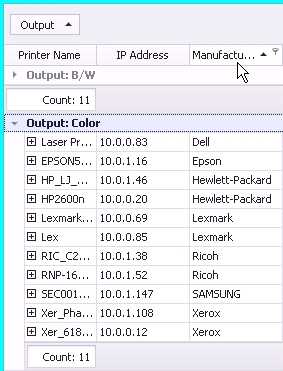
Example: Group by manufacturer
Grouping inventory by manufacturer tells how many printers are HP, Canon, Lexmark, Xerox, etc.
Drag the Manufacturer column heading to the Group By box above it.
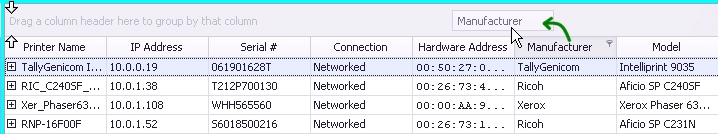
The information grid now shows how many printers there are from each manufacturer.
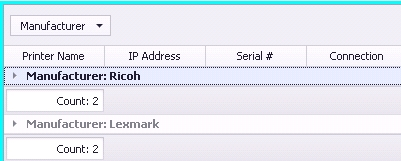
Expand a manufacturer to see individual printers.
Example: Display color printers sorted by manufacturer
Drag the Output column heading to the Group By box.
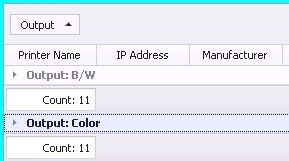
Expand the color printers.
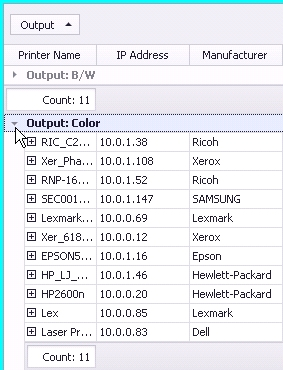
Click the Manufacturer column heading to sort alphabetically by manufacturer.
Creating a Basic Filter
You can create a basic filter for any column of data.
- Pause the cursor over the column heading until a funnel appears.
- Click the funnel, and click (Custom).

- In the Custom AutoFilter dialog box, enter the conditions for your filter, and click OK.
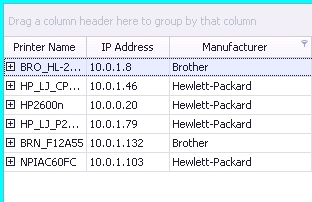
Example: Specific manufacturers
- Filter the Manufacturer column, and show only those rows where the value of the column equals Brother or equals Hewlett-Packard.
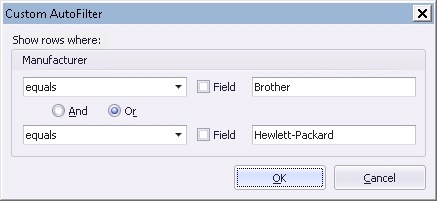
- Click OK to apply the filter to the information grid.
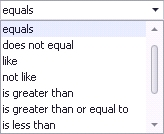
Because you can express AutoFilter conditions in many ways, including equals, does not equal, is greater than, and is less than, you have great flexibility in creating filters.
Creating a Complex Filter
Whereas a basic filter operates on a single column, a complex filter provides a way to mine or view a combination of columns to show data about the cost and performance of the printer fleet.
The best approach to using complex filters, which will save time constructing them, is to write out by hand the columns to be mined. Then, find the view that makes those columns available.
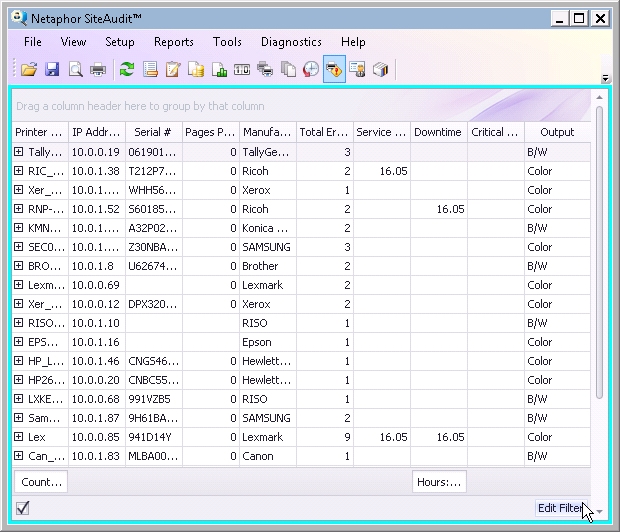
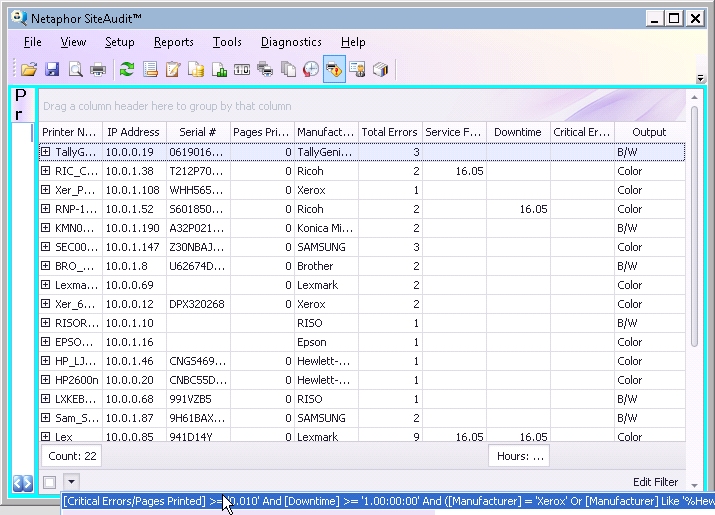
Example: Problematic printers from MFP manufacturers
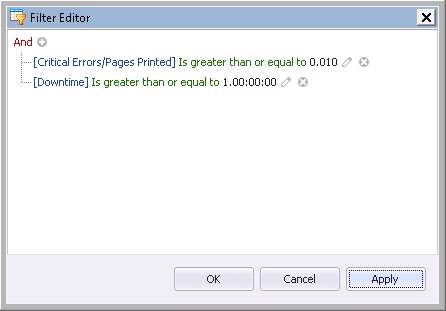
The metric that interests you is critical errors and downtime for printers from MFP manufacturers. The Problem Analysis view makes available the columns Manufacturer, Critical Errors, Pages Printed, and Downtime.
- With the Problem Analysis view displayed, click the Edit Filter button at the bottom right.
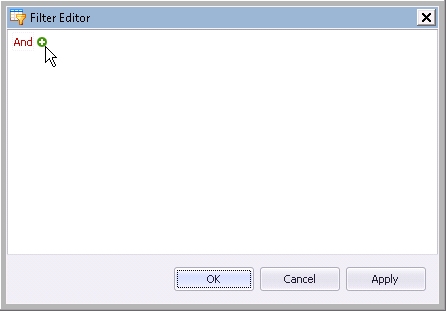
- Click the plus sign to add a condition.
- Click Asset tag, and in the list that appears, click Critical Errors/Pages Printed.
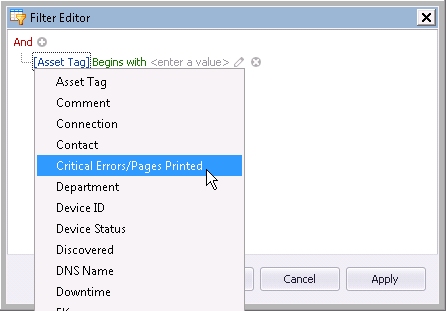
- Click Equals, and in the list that appears, click Is greater than or equal to.
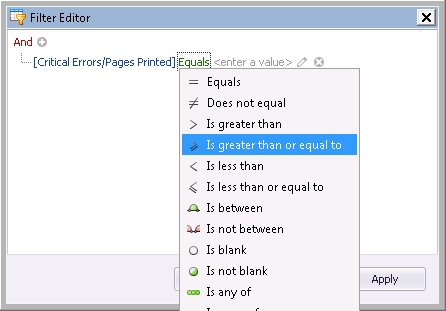
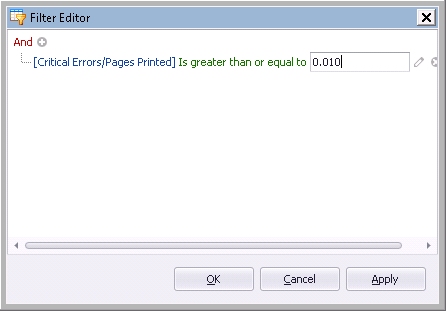
- Click <Enter a value>, and in the box that appears, type your threshold for the ratio of critical errors to pages printed.
- Click the plus sign again, and edit the new condition.
- Click And, and add a group of conditions.
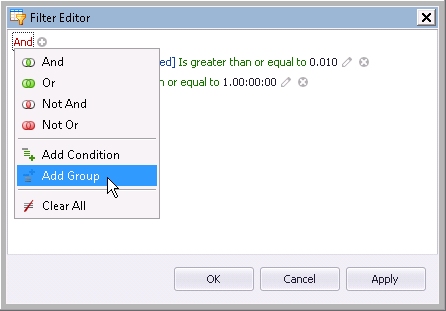
- Click the new And, and change it to Or, because the next condition includes any of a list of manufacturers (this one or that one).
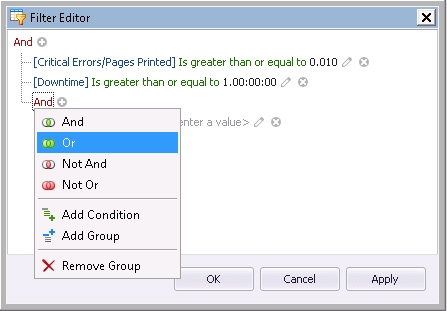
- For each condition you want to include in the filter, click the plus sign again, and edit the condition.
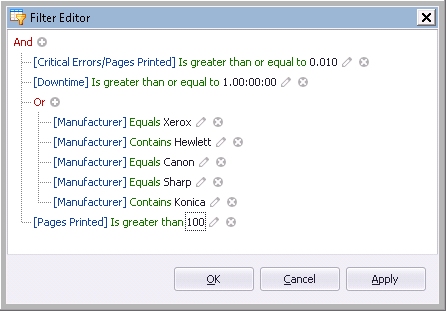
This filter will show all printers from five MFP makers with downtime greater than one day, with an error frequency greater than 1% while printing at least 100 pages during the month. These are the problem printers.
Example: Volume analysis metric defined by the minimum number of color and B/W pages

This filter from the Volume Analysis view shows the color and B/W output from color printers. It answers the question whether color printers are used for color only or a mix of color and B/W. Because color printers cost more and per-print cost is greater, this is useful for controlling costs.
Example: Estimated Help Desk Calls defined by severity, duration, training level and description
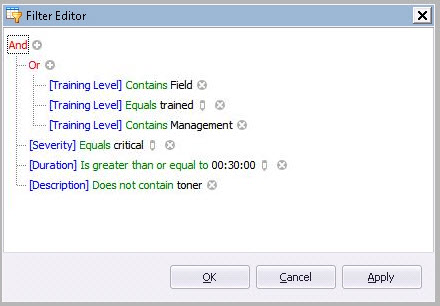
This filter from the Incident History view shows the number of critical incidents over 30 minutes in duration that require a trained person and do not concern toner. (It is assumed toner is changed without help desk intervention.)
SiteAudit’s notification capability allows incident information to be automatically emailed to help desk, service and administrator people. The benefit of SiteAudit’s rules-based notification capability is higher employee productivity as printers have better uptime performance. Knowing how to use filters is applicable to creating notification rules and conditions; both use the same logic.
Reports
You can use filters to create custom reports, such as a report that shows the top problem printers. Once the filter is applied to a view, click Print Preview on the File menu. (See Making Custom Reports.)
Reusing Filters
You can reuse complex filters. For example, you can use the Top Problem Printers filter to generate a report each month.
- Click the arrow at the bottom left part of the information grid.
- Click the filter that you want to apply.
You can modify the filter by clicking the Edit Filter button and changing the conditions.